What I Built
A data-driven research map for historical fieldwork on the Thames foreshore and surrounding London locations. The map visualises 17 sites, each scored algorithmically for research potential based on a weighted combination of historical significance, accessibility, documented finds from comparable sites, and tidal access windows.
The key feature is the historic map overlay system: toggle between modern OpenStreetMap tiles and georeferenced historic OS maps sourced from the National Library of Scotland (NLS) via MapTiler. Seeing a location on an 1890s map alongside the modern street layout makes it immediately obvious which areas have changed and which remain archaeologically undisturbed.
The Hotspot Scoring Algorithm
Each location is scored across four weighted dimensions and combined into a composite hotspot score displayed as a colour gradient on the map: green (low interest) through amber to red (high priority).
The Map
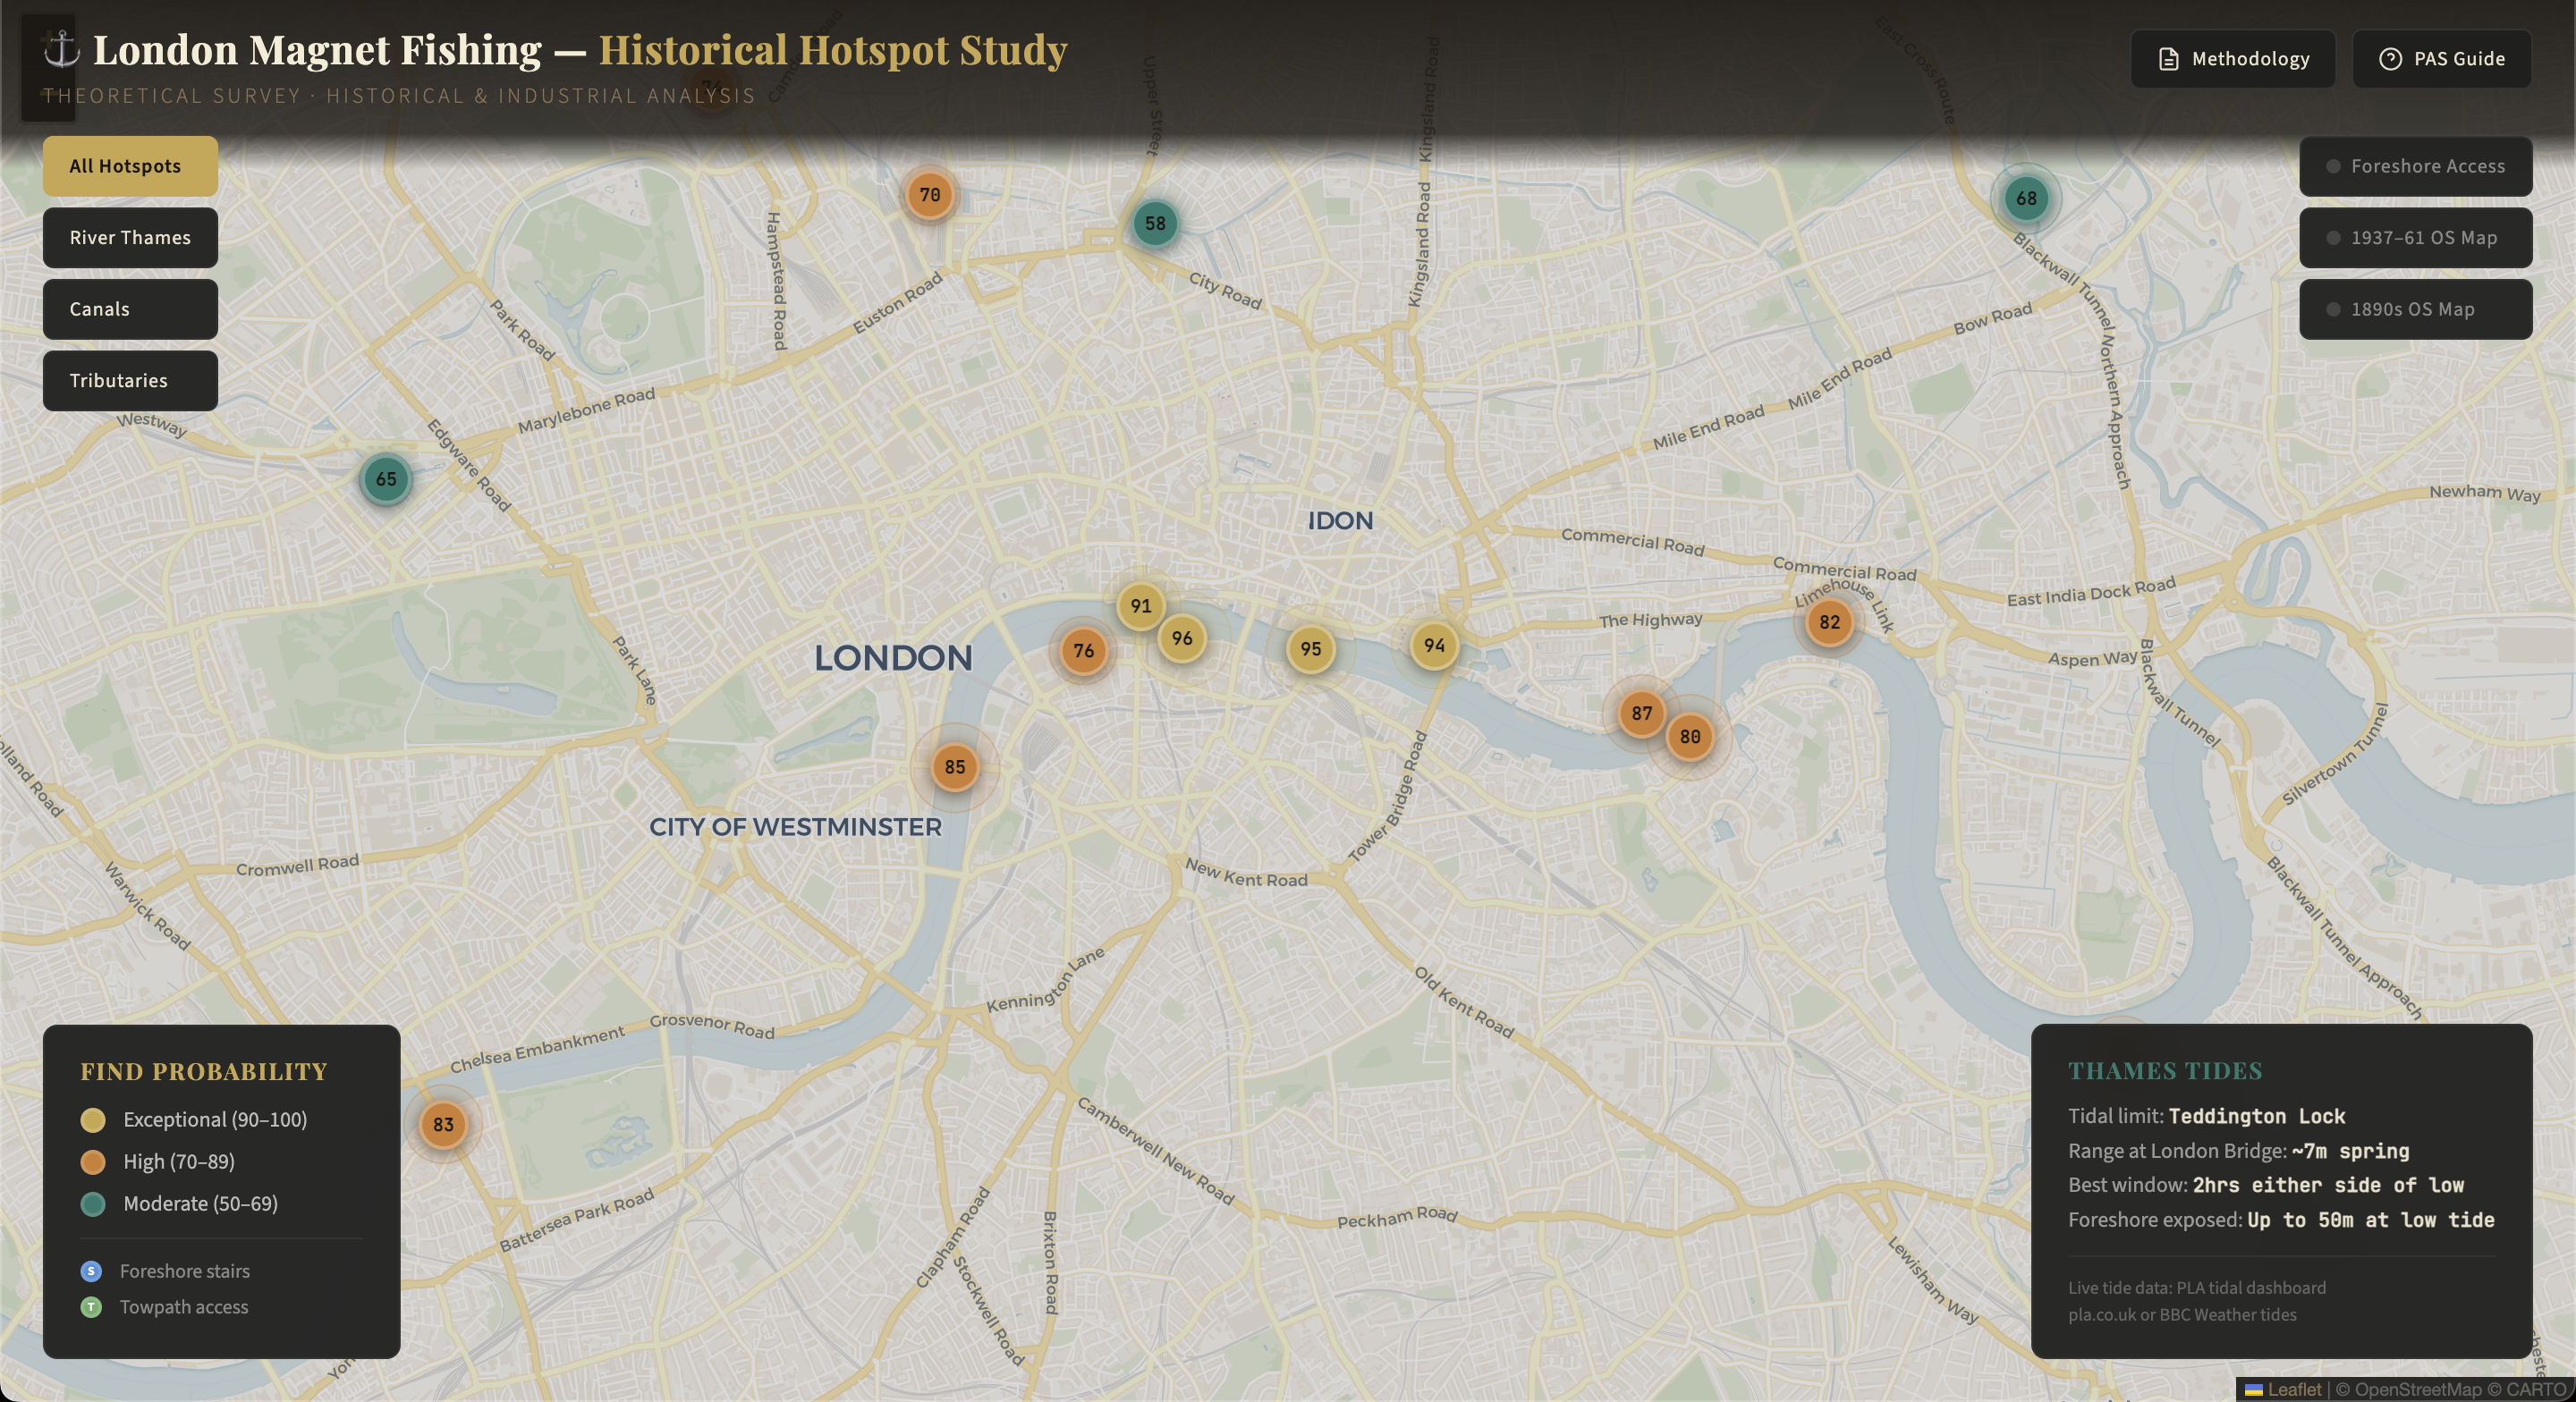
Modern Map View with Scored Locations
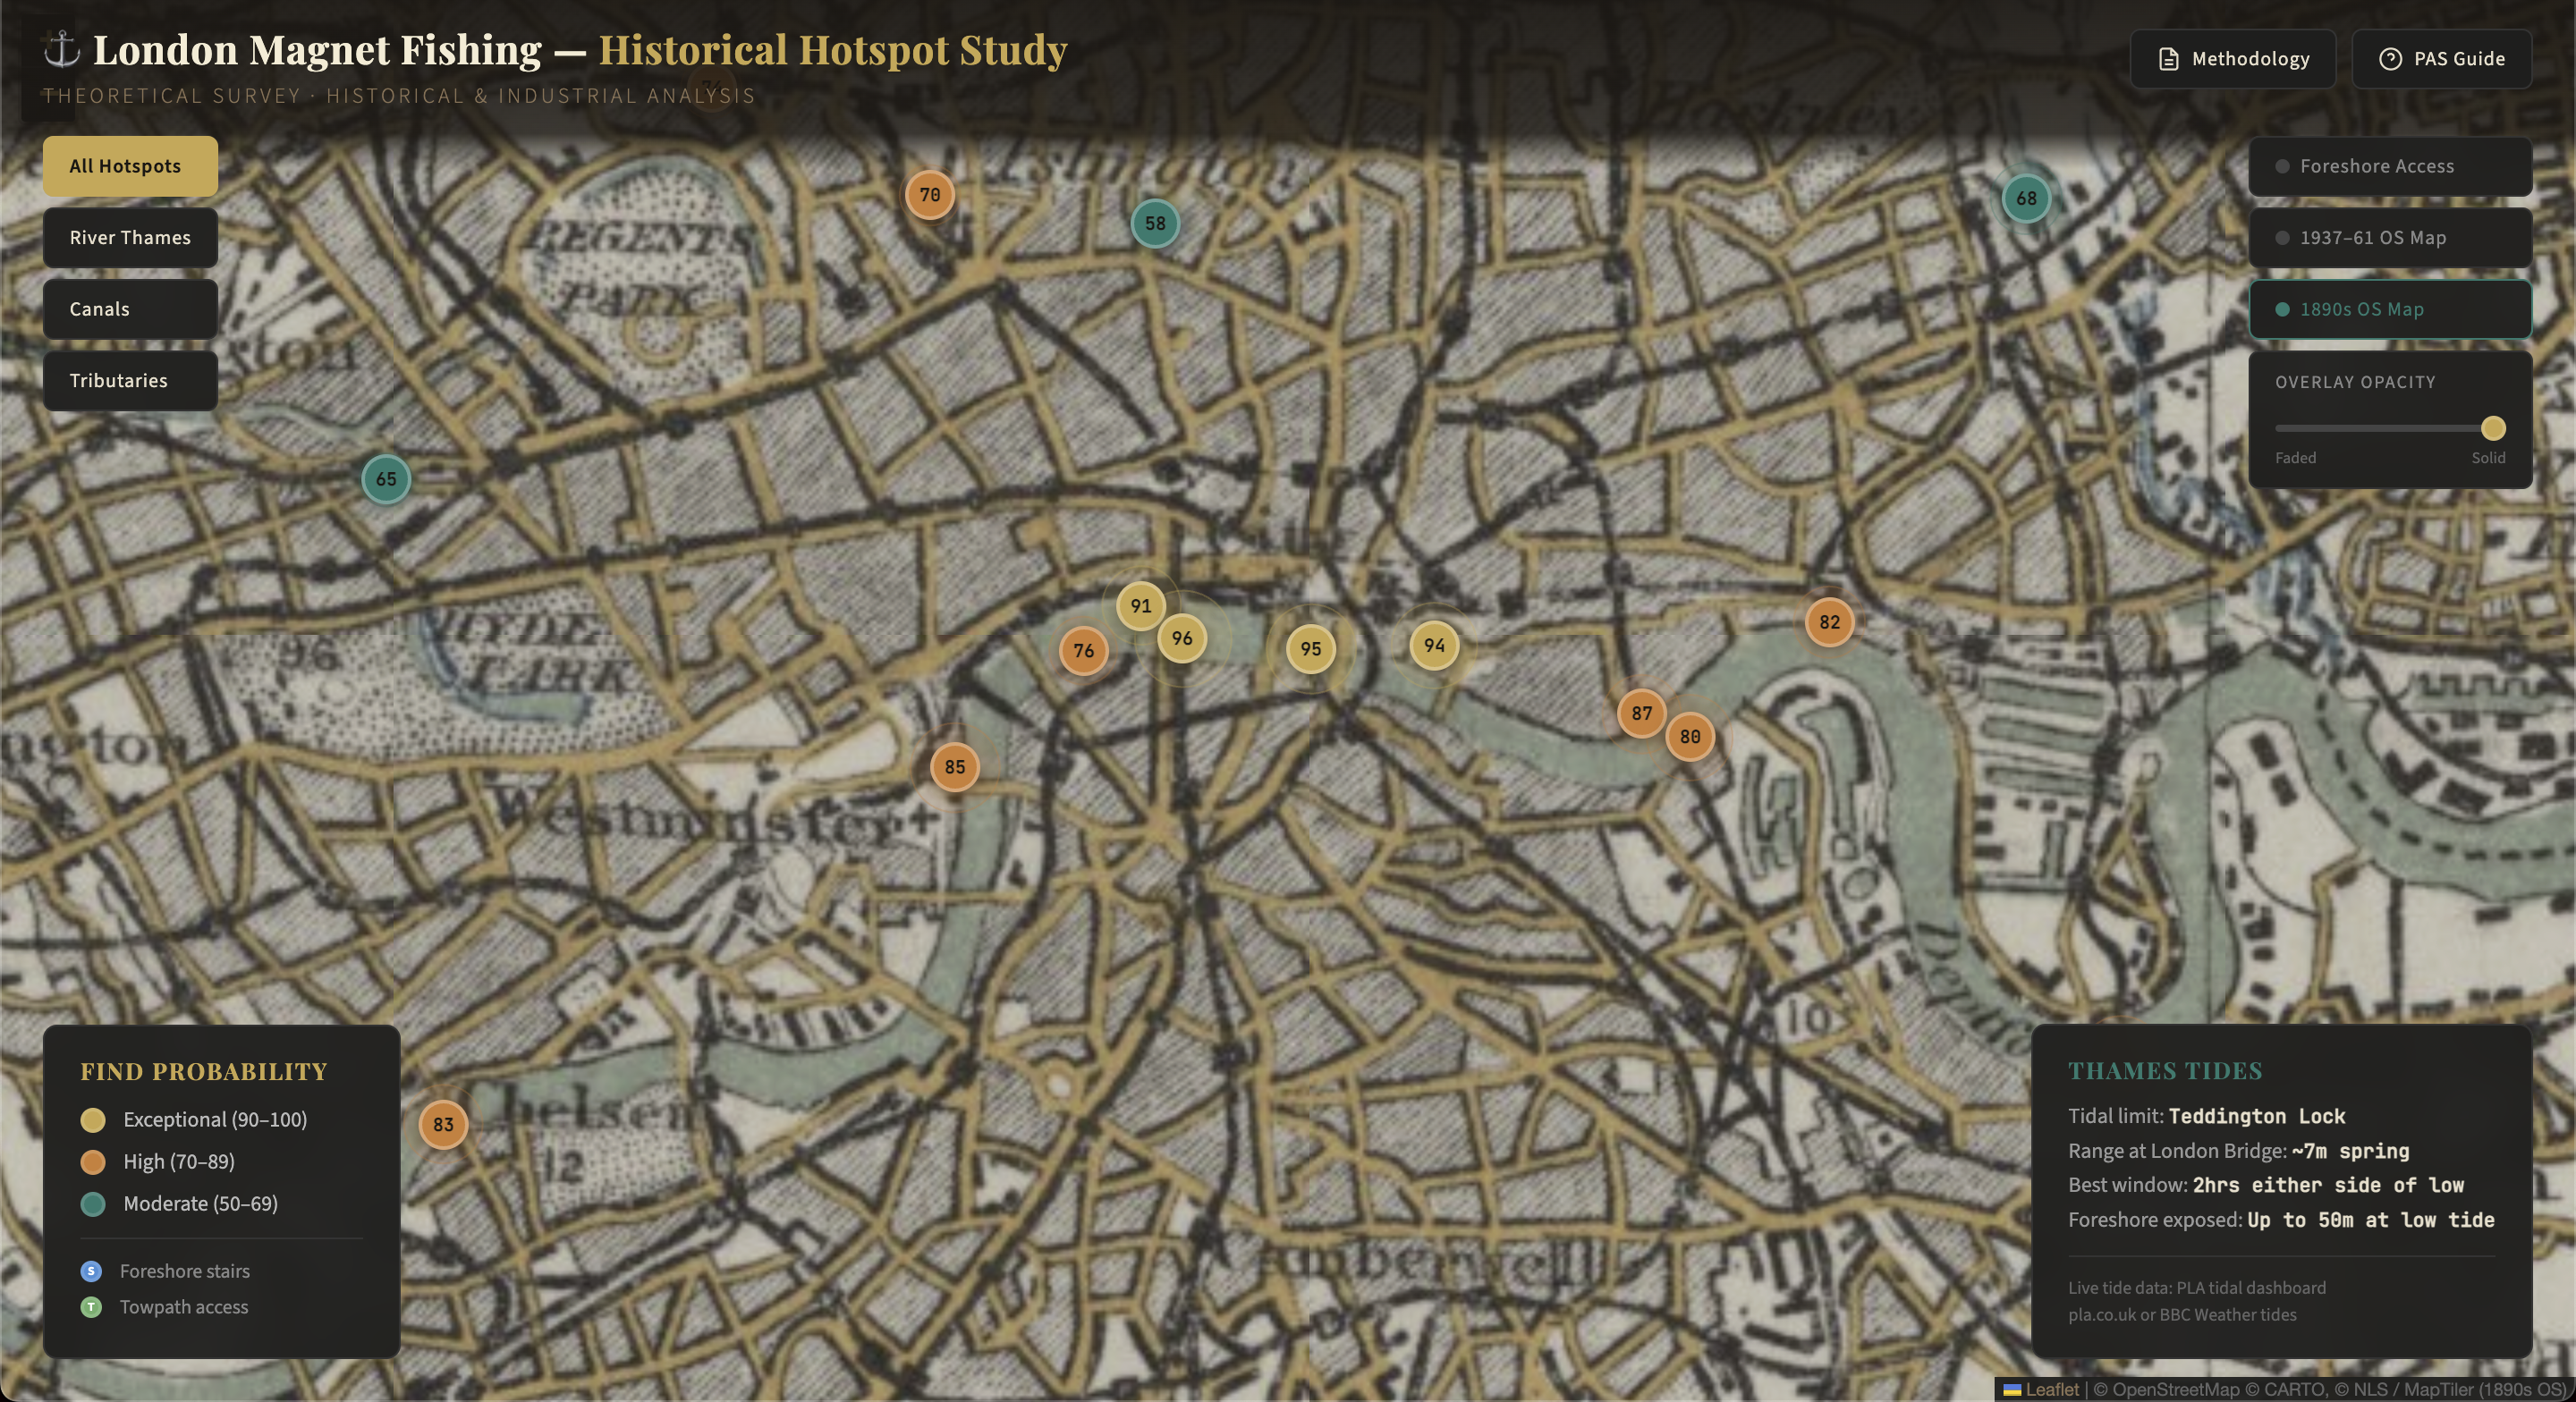
1890s Historic OS Map Overlay via NLS/MapTiler
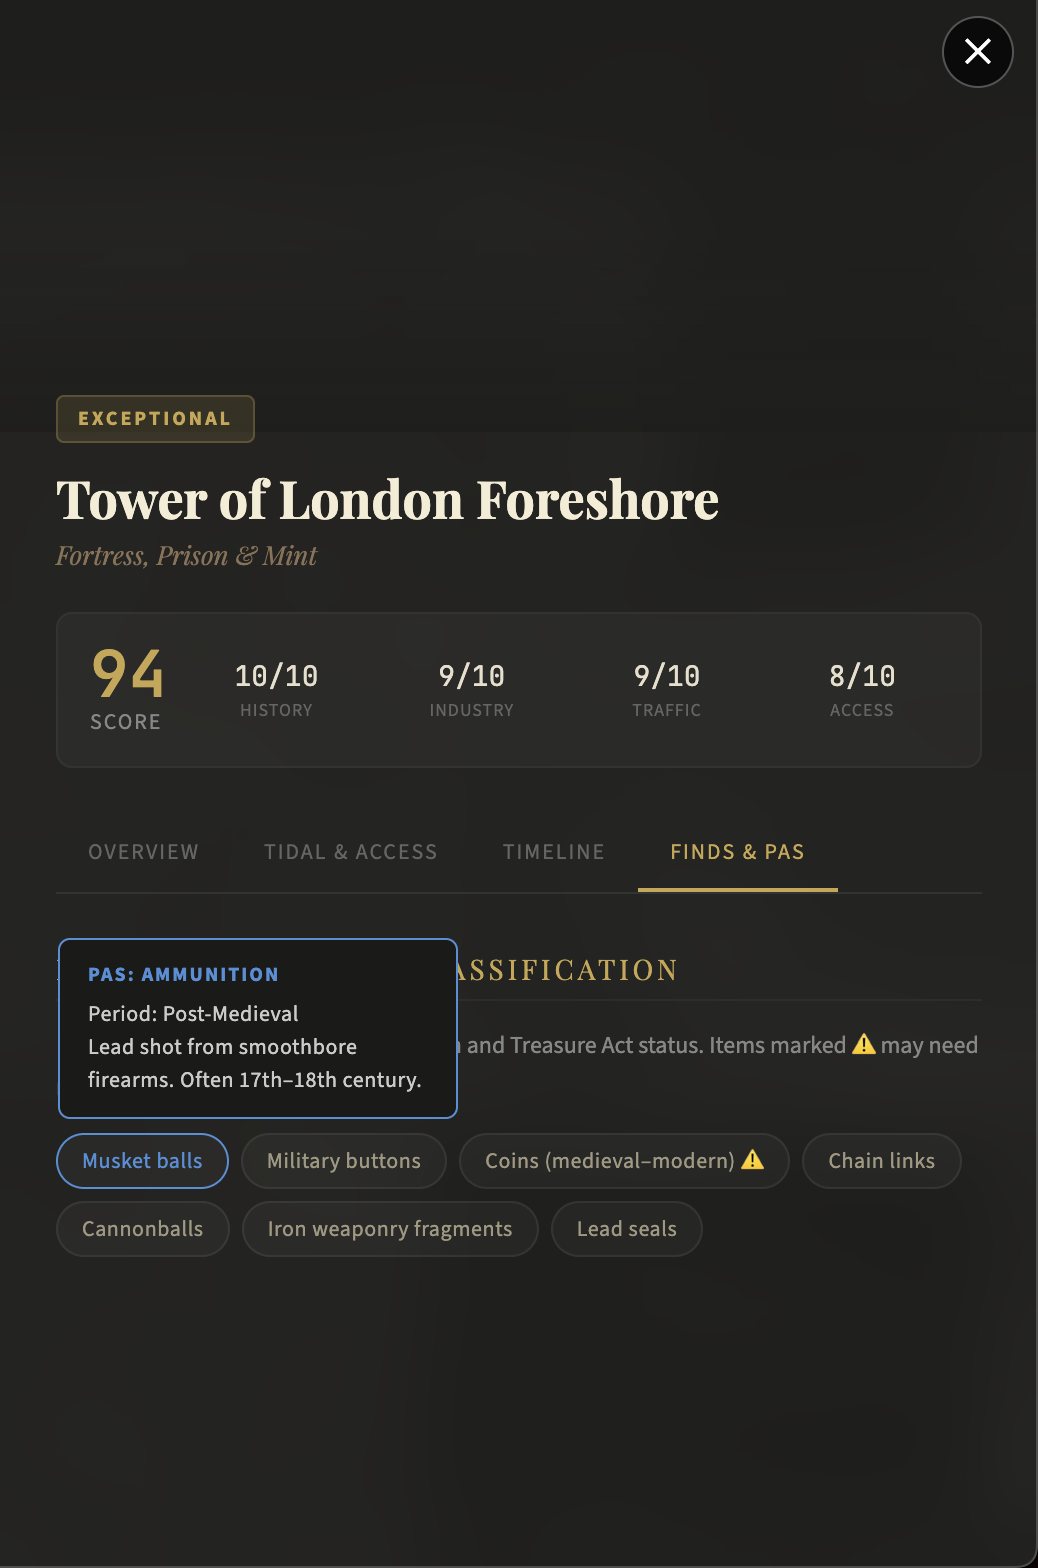
Tower of London Foreshore — Research Notes and Finds
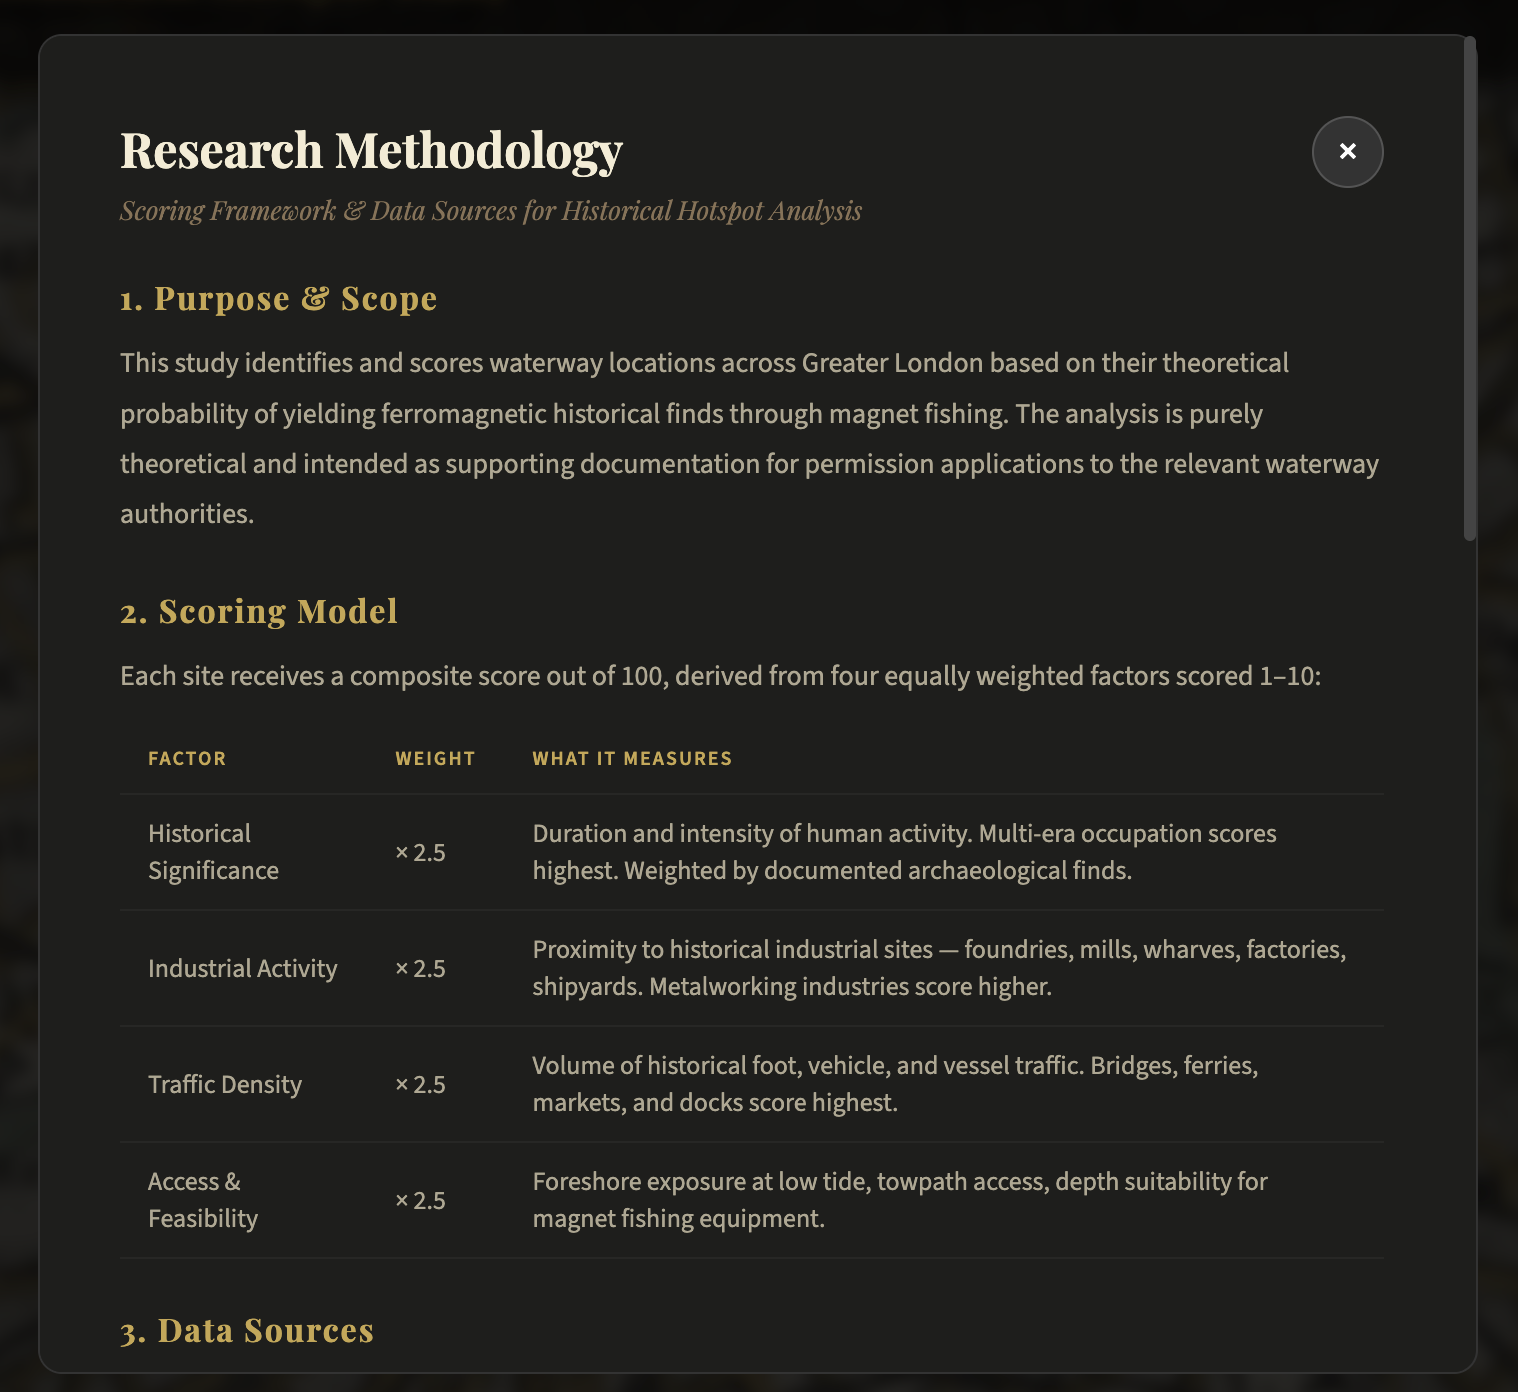
Research Methodology
Key Features
Historic Map Overlays
Toggle between modern OSM tiles and georeferenced historic OS maps (1890s–1930s) via NLS/MapTiler tile endpoints. Opacity slider blends historic and modern layers. Useful for identifying which modern structures overlie historically significant ground.
Scored Location Markers
17 locations rendered as circle markers. Colour and radius both encode the hotspot score — high-scoring locations are larger and deeper red. Click any marker to open a popup with the score breakdown, research notes, and access information.
Foreshore Access Mapping
Thames foreshore locations include tidal access data: which areas are accessible at low tide, required permits, and the approximate accessible window relative to tide times. Drawn as a separate layer that can be toggled independently.
Research Notes
Each location has structured research notes: historical context, documented finds from the area, relevant archive references, and fieldwork observations. Stored as JSON and rendered in the popup. Designed to be updated as fieldwork progresses.